Track ROI Through Marketing Analytics Dashboards

Track ROI Through Marketing Analytics Dashboards

Data plays a pivotal role in shaping marketing strategies. Businesses must effectively gather, manage, and analyse data to remain competitive and make informed decisions. However, the abundance of data presents a challenge for marketing teams. How can we turn this wealth of data into actionable insights that drive marketing strategies? The solution lies in utilising a marketing dashboard.


In this article, we’ll delve into various types of marketing dashboards, their significance, and their contribution to marketing analytics efforts.

What is a Marketing ROI Dashboard?

As you know, a marketing dashboard serves as a centralised tool aimed at offering marketers a holistic view of their marketing performance in real time. Its core objective is to streamline data management and analysis, enabling marketers to swiftly make informed decisions.


A Marketing ROI dashboard operates similarly but it zeroes in on essential business metrics. Its goal is to provide a clear and unified view, highlighting the marketing and sales efforts that have the most impact on revenue.

Why You Should Track the ROI of Your Marketing

Tracking return on investment (ROI) is vital for any successful business, regardless of its size.

It provides the most accurate insight into which marketing investments yield positive returns and which do not.

While some marketers prioritize lead quantity to boost revenue, leads alone do not guarantee income. Without conversions, they hold little value for your business.

For instance, consider two simultaneous Google Ads campaigns, both running for 30 days with a $1,000 budget:

– Campaign A generated 25 leads at $40 per lead.

– Campaign B produced 9 leads at $111.11 per lead.

Initially, you might lean towards investing more in Campaign A due to its higher lead count. However, if we factor in the revenue generated:

– Campaign A resulted in $2,000 in sales, equating to a 200% Return on Ad Spend (ROAS).

– Campaign B, despite fewer leads, garnered $10,000 in revenue, achieving a ROAS of 1000%.

In this scenario, Campaign B proves to be the more lucrative investment, showcasing the importance of focusing on revenue rather than just lead quantity.

By prioritizing revenue-driven metrics, businesses gain valuable insights into their marketing performance. This allows them to optimize their strategies, allocate resources effectively, and achieve more cost-effective results.
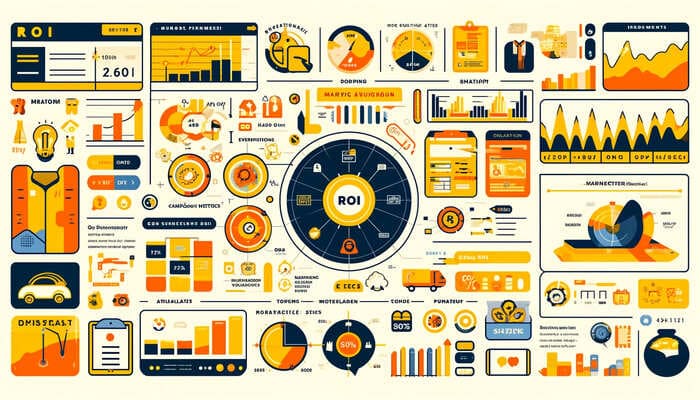
Key Components of a Comprehensive Marketing ROI Dashboard

A marketing ROI dashboard typically comprises several key components to effectively measure and analyze the performance of marketing campaigns and initiatives. Here are some essential elements:


  1. ROI Metrics: Include metrics that directly measure the return on investment, such as:
  • Revenue generated: Total revenue attributed to marketing efforts.
  • Cost of marketing: Total expenses incurred for marketing campaigns.
  • ROI: Calculated as (Revenue – Cost) / Cost, expressed as a percentage.


  1. Key Performance Indicators (KPIs): Track various KPIs that indicate the effectiveness of marketing efforts, including:
  • Conversion rate: Percentage of visitors who take the desired action (e.g., make a purchase, sign up for a newsletter).
  • Customer acquisition cost (CAC): Cost associated with acquiring a new customer.
  • Customer lifetime value (CLV): Predicted revenue from a customer over their entire relationship with the company.


  1. Campaign Performance: Evaluate the performance of individual marketing campaigns, channels, or initiatives. This may include:
  • Impressions: Number of times an ad or content is displayed.
  • Click-through rate (CTR): Percentage of people who click on an ad or link after seeing it.
  • Conversion rate by channel: Percentage of conversions attributed to each marketing channel (e.g., social media, email, paid search).


  1. Attribution Analysis: Understand the contribution of each marketing channel or touchpoint to conversions. Common attribution models include:
  • First-touch attribution: Credits the first touchpoint a customer interacts with before converting.
  • Last-touch attribution: Credits the last touchpoint before conversion.
  • Multi-touch attribution: Considers multiple touchpoints along the customer journey.


  1. Budget Allocation: Compare budget allocations across different marketing channels and campaigns to optimize spending. This may involve:
  • Budget vs. actual spend: Comparison of planned versus actual expenses for each marketing activity.
  • Cost per lead (CPL): Cost associated with generating a single lead.


  1. Trend Analysis: Monitor trends over time to identify patterns and make informed decisions. This includes:
  • Month-over-month or year-over-year comparisons of key metrics.
  • Seasonal trends or fluctuations in consumer behaviour.


  1. Data Visualization: Present data in visually appealing and easy-to-understand formats, such as:
  • Charts and graphs: Bar charts, line graphs, pie charts, etc., to visualize metrics and trends.
  • Dashboards: Interactive dashboards that allow users to drill down into specific data points or time periods.


  1. Goal Tracking: Set and track specific goals for marketing campaigns and initiatives. This may include:
  • SMART goals (Specific, Measurable, Achievable, Relevant, Time-bound) aligned with overall business objectives.
  • Goal attainment: Measure progress toward achieving predefined goals.


  1. Customer Segmentation: Analyze the performance of marketing efforts among different customer segments. This could involve:
  • Segment-specific metrics: Analyze how different segments respond to marketing campaigns.
  • Personalization effectiveness: Assess the impact of personalized marketing strategies on different customer segments.


  1. Data Integration: Integrate data from various sources, such as CRM systems, advertising platforms, and web analytics tools, to provide a comprehensive view of marketing performance.


By incorporating these key components into a marketing ROI dashboard, businesses can gain valuable insights into the effectiveness of their marketing strategies and make data-driven decisions to optimize their ROI.

Benefits of Using Marketing ROI Dashboards

Utilizing marketing ROI dashboards offers numerous benefits for businesses looking to optimize their marketing efforts and maximize their return on investment. Here are some key advantages:


  1. Data-Driven Decision Making: Marketing ROI dashboards provide real-time access to crucial marketing metrics and KPIs, enabling data-driven decision-making. By analyzing accurate and up-to-date data, marketers can make informed choices about budget allocation, campaign optimization, and strategy adjustments.


  1. Performance Monitoring: Dashboards allow marketers to monitor the performance of their marketing campaigns and initiatives in real-time. This capability enables them to quickly identify underperforming campaigns or channels and take corrective actions to improve results.


  1. Optimized Resource Allocation: By tracking the ROI of different marketing channels and initiatives, businesses can allocate their resources more effectively. Marketing ROI dashboards help identify high-performing channels that deliver the best return on investment, allowing organizations to invest more resources where they are most likely to generate revenue.


  1. Identifying Trends and Patterns: Marketing ROI dashboards facilitate trend analysis by providing historical data and trend visualization tools. Marketers can identify patterns in consumer behavior, seasonal trends, or the effectiveness of specific marketing strategies over time, allowing them to adjust their tactics accordingly.


  1. Improved Accountability: With clear visibility into the performance of marketing campaigns, stakeholders can hold marketing teams accountable for their efforts and results. Marketing ROI dashboards provide transparency and accountability, ensuring that marketing initiatives align with business objectives and deliver measurable results.


  1. Optimized Marketing Budgets: By understanding the ROI of different marketing activities, organizations can optimize their marketing budgets for maximum efficiency. Marketing ROI dashboards help identify opportunities to reallocate budget from low-performing initiatives to those with higher ROI potential, ultimately improving overall marketing effectiveness.


  1. Enhanced Forecasting and Planning: With access to historical data and performance trends, marketers can better forecast future outcomes and plan their marketing strategies accordingly. Marketing ROI dashboards provide valuable insights that enable more accurate forecasting of revenue, customer acquisition, and other key metrics.


  1. Facilitated Collaboration and Communication: Marketing ROI dashboards serve as a centralized platform for sharing insights and performance data across marketing teams and other stakeholders. This facilitates collaboration and communication, ensuring that everyone involved in marketing efforts is aligned with goals and objectives.


  1. Continuous Improvement: By continuously monitoring and analyzing marketing performance, organizations can identify areas for improvement and implement optimization strategies iteratively. Marketing ROI dashboards support a culture of continuous improvement, helping businesses stay agile and responsive to changing market conditions.


  1. Demonstrated Marketing ROI: Perhaps most importantly, marketing ROI dashboards enable businesses to demonstrate the impact of their marketing efforts on the bottom line. By quantifying the return on investment and attributing revenue to specific marketing activities, organizations can prove the value of marketing initiatives and justify future investments.


Overall, marketing ROI dashboards provide a comprehensive framework for measuring, analyzing, and optimizing marketing performance, ultimately driving business growth and profitability.

Metrics to Track on Marketing ROI Dashboard

When building a marketing ROI dashboard, it’s important to track a variety of metrics that provide insight into different aspects of marketing performance and return on investment. Here are some essential metrics to include:


  1. Revenue: Total revenue generated from marketing activities. This could be broken down by product/service, customer segment, or marketing channel.


  1. Cost of Marketing: Total expenses incurred for marketing efforts, including advertising spend, agency fees, content creation costs, etc.


  1. ROI (Return on Investment): Calculated as (Revenue – Cost) / Cost, expressed as a percentage. This metric indicates the efficiency of marketing spending in generating revenue.


  1. Customer Acquisition Cost (CAC): The cost associated with acquiring a new customer. Divide total marketing costs by the number of new customers acquired within a specific period.


  1. Customer Lifetime Value (CLV): The predicted revenue a customer will generate over their entire relationship with the company. Compare CLV to CAC to ensure that customer acquisition costs are justified by the value those customers bring over time.


  1. Conversion Rate: The percentage of visitors or leads that complete a desired action, such as making a purchase, signing up for a newsletter, or filling out a contact form.


  1. Click-Through Rate (CTR): The percentage of people who click on a link or ad after seeing it. This metric is commonly used for online advertising campaigns.


  1. Impressions: The number of times an ad or piece of content is displayed to users. Tracking impressions can help gauge the reach and visibility of marketing campaigns.


  1. Attribution Metrics: Metrics that attribute conversions or sales to specific marketing channels or touchpoints. This could include first-touch attribution, last-touch attribution, or multi-touch attribution models.


  1. Customer Retention Rate: The percentage of customers who continue to do business with the company over time. A high retention rate indicates strong customer satisfaction and loyalty.


  1. Churn Rate: The percentage of customers who stop doing business with the company within a given period. High churn rates can indicate issues with product/service quality or customer experience.


  1. Marketing Channel Performance: Breakdown of performance metrics (e.g., conversion rate, ROI) by marketing channel, such as social media, email marketing, paid search, organic search, etc.


  1. Campaign Performance: Performance metrics for individual marketing campaigns, including impressions, clicks, conversions, and ROI.


  1. Website Traffic and Engagement: Metrics related to website traffic and user engagement, such as total visits, page views, bounce rate, time on site, and top-performing pages.


  1. Social Media Metrics: Engagement metrics from social media platforms, including likes, shares, comments, and follower growth.


  1. Email Marketing Metrics: Metrics related to email marketing campaigns, such as open rate, click-through rate, conversion rate, and unsubscribe rate.


  1. Content Performance: Metrics related to the performance of content marketing efforts, such as blog post views, downloads of gated content, and engagement with videos or infographics.


By tracking these metrics on a marketing ROI dashboard, businesses can gain valuable insights into the effectiveness of their marketing efforts and make data-driven decisions to optimize ROI and drive business growth.

Needto Take Your Startup to the Next Level?

Schedule a free consultation call with our team today

What to Look for While Choosing a Marketing ROI Dashboard

When choosing a marketing ROI dashboard, it’s essential to consider several factors to ensure that the dashboard meets your specific needs and provides actionable insights for optimizing marketing performance. Here’s what to look for:


  1. Customization Options: Look for a dashboard solution that offers customization options to tailor the dashboard to your organization’s unique goals, metrics, and branding requirements. The ability to customize widgets, layouts, and data visualizations ensures that the dashboard provides relevant and actionable insights for your marketing team.


  1. Integration Capabilities: Ensure that the dashboard can integrate with your existing marketing technology stack, including CRM systems, advertising platforms, web analytics tools, and data warehouses. Seamless integration allows you to consolidate data from multiple sources and provides a comprehensive view of marketing performance.


  1. Ease of Use: Choose a dashboard solution that is intuitive and easy to use for both technical and non-technical users. Look for features such as drag-and-drop interface, pre-built templates, and customizable dashboards to streamline the dashboard creation and management process.


  1. Real-Time Data Updates: Opt for a dashboard solution that provides real-time or near real-time data updates. Timely access to up-to-date marketing data enables proactive decision-making and allows you to quickly respond to changes in market conditions or campaign performance.


  1. Mobile Accessibility: Ensure that the dashboard is mobile-responsive and accessible on a variety of devices, including smartphones and tablets. Mobile accessibility allows marketing teams to access critical insights on the go and stay informed, regardless of their location.


  1. Data Visualization: Look for dashboard solutions that offer powerful data visualization capabilities, including interactive charts, graphs, and widgets. Effective data visualization makes it easier to identify trends, patterns, and outliers in marketing data and communicate insights to stakeholders.


  1. Advanced Analytics: Choose a dashboard solution that provides advanced analytics features, such as predictive modeling, cohort analysis, and A/B testing capabilities. Advanced analytics empower marketers to conduct in-depth analysis, uncover actionable insights, and optimize marketing strategies for better ROI.


  1. Security and Compliance: Ensure that the dashboard solution prioritizes data security and compliance with relevant regulations, such as GDPR or HIPAA. Look for features such as role-based access control, data encryption, and audit trails to protect sensitive marketing data and ensure compliance with data privacy laws.


  1. Scalability: Consider the scalability of the dashboard solution to accommodate future growth and increasing data volumes. Choose a solution that can scale seamlessly with your organization’s evolving needs, whether you’re expanding your marketing efforts, adding new data sources, or onboarding additional users.


  1. Customer Support and Training: Evaluate the level of customer support and training offered by the dashboard provider. Look for providers that offer comprehensive training resources, documentation, and responsive customer support to help you maximize the value of the dashboard and address any technical issues or questions that arise.


By considering these factors when choosing a marketing ROI dashboard, you can select a solution that empowers your marketing team with actionable insights, drives better decision-making, and ultimately maximizes the return on your marketing investments.

Tools offering Dashboards to Visualise Marketing ROI

Now that you understand the importance of tracking marketing ROI, let’s explore some effective solutions to help you accomplish this goal.

Looker Studio by Google

Looker Studio, a component of Looker’s business intelligence platform, is gaining recognition for its prowess in marketing attribution and revenue tracking. By seamlessly integrating CRM and marketing data, Looker Studio empowers businesses to attribute credit to various touchpoints along the customer journey.


This integration enables users to pinpoint which marketing campaigns contribute most to revenue, facilitating data-driven decision-making to optimize marketing strategies. Looker Studio’s user-friendly interface and drag-and-drop functionality make it accessible to marketers of all skill levels, allowing them to create custom reports and dashboards tailored to their specific needs.


Most of the features of Looker Studio are available on free plan but its paid plan is also completely available as it is priced at $9 per month. With Looker Studio, businesses can harness the power of data to drive growth and maximize return on investment without breaking the bank.

HubSpot

You’re likely familiar with HubSpot, renowned for its sales and marketing automation capabilities. However, it’s also gaining recognition in the marketing attribution and revenue tracking sphere.


HubSpot functions by integrating your CRM and marketing data, enabling you to attribute credit to various touchpoints throughout the customer journey. This allows you to identify which marketing campaigns contribute most to revenue and make informed decisions to enhance your strategies.


Unfortunately, HubSpot’s revenue attribution reporting is exclusive to its Enterprise package, making it inaccessible to small and medium-sized businesses. Pricing for this package starts at $890 per month (billed annually at $9600) for 10,000 contacts, with additional costs for larger contact lists.

Kissmetrics

Another valuable tool for tracking revenue-generating channels is Kissmetrics. It is a person-based analytics product designed to identify, understand, and enhance the metrics crucial for your business growth.


With its revenue report feature, you can easily determine the revenue generated from your marketing efforts. Additionally, you can break down this revenue by campaign, enabling you to identify which campaigns yield the highest lifetime value and lowest churn rate.


Kissmetrics offers three pricing tiers: Silver at $299 per month, Gold at $499 per month, and Custom pricing options tailored to your specific needs.

Plannuh

Plannuh is a comprehensive performance tool designed to streamline the management and tracking of your business goals, marketing budget, and ROI.


By integrating with various marketing tools used by marketers to develop plans, budgets, and reports, Plannuh provides a centralized platform for consolidating all your marketing data. This allows you to gain a holistic view of your marketing activities and their impact.


Pricing for Plannuh is based on the size of your marketing budget, ensuring that you pay according to your specific needs. For instance, if your marketing budget amounts to $650,000, you can expect to pay $750 per month for the service.

Cyfe

Cyfe is a robust data visualization and dashboard reporting solution designed to streamline the collection, monitoring, and analysis of key marketing and business performance metrics.


Ideal for marketers seeking to delve deeper into their metrics and gain insights beyond traditional marketing metrics, Cyfe offers a centralized platform to consolidate and analyze data from various sources.


Cyfe offers four pricing plans to cater to different business needs: Starter at $19 per month, Standard at $29 per month, Pro at $49 per month, and Premier at $89 per month. Each plan provides varying levels of features and capabilities to suit different requirements.

Ruler Analytics

Ruler Analytics offers a comprehensive marketing attribution solution designed to track and attribute revenue to various marketing touchpoints within individual customer journeys.


Here’s how it works: Ruler Analytics meticulously captures and tracks every visitor’s interactions across multiple sessions, traffic sources, and keywords. Upon conversion, whether it’s through a form fill, phone call, or live chat inquiry, Ruler Analytics matches the captured contact details to the lead’s marketing touchpoints.


This conversion data and marketing source information seamlessly integrate with your CRM system, providing your sales and customer support teams with valuable insights into lead interactions and interests.


As leads progress through the sales pipeline, Ruler Analytics continuously updates the data, enabling your marketing team to accurately assess lead quality and progression within the funnel.


Upon completion of a purchase or deal, Ruler Analytics precisely attributes revenue back to the marketing channels, campaigns, keywords, and ads that influenced the conversion.


Furthermore, Ruler Analytics offers flexible integration options with nearly any marketing tool or application, ensuring convenient access to revenue and attribution data within your preferred platforms.


With pricing starting at £199 per month and various customizable plans available, Ruler Analytics offers tailored solutions to meet your specific requirements. Additionally, customers can benefit from a 20% discount by opting for annual payment, and special rates are available for agency partners.


Conclusion

If you are just getting started, you can start using Google’s Data Studio to start analysing your ROI with visual dashboards. However, if you are at enterprise level, HubSpot is going to be a better choice for you. You can follow this guide to setup your marketing ROI dashboards with right KPIs irrespective of the tool you choose.

Next up: Paid Ads 101 for Startups: A Beginners Guide

Ever wondered how you can transform your paid advertising strategy to not only connect with your audience but also maximize your budget and drive substantial results? In this guide, we’ll explore how to elevate your paid ad campaigns, ensuring every dollar spent brings in the best returns. Get ready to learn how to take your advertising efforts to new heights and achieve remarkable outcomes for your startup.

Chapter 4.3: Paid Ads 101 for Startups: A Beginners Guide